事象発生日:2017-11-28
記事公開日:2017-11-28
アクセス数:22928
gnuplotのコマンドセットの備忘録 その3.
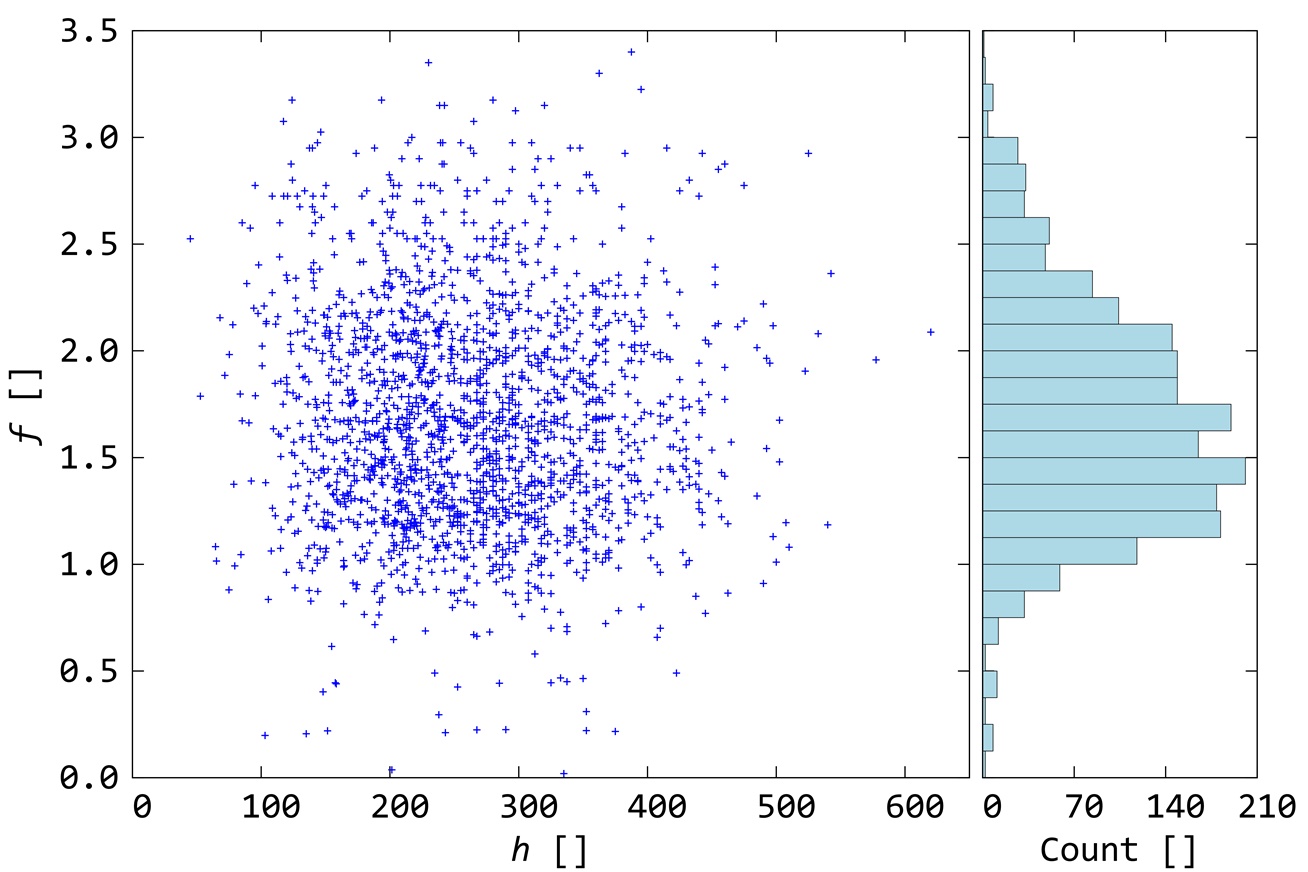
今回は,散布図の横にヒストグラムを同時にプロットする.
横方向の棒グラフ作成が標準で実装されていないため,ポイントとなる.
Microsoft Windows 10 Home (64bit)
Gnuplot Version 5.2 patchlevel 0
散布図なので,単純な2次元データである.
▶ データファイル (data.dat [38,000 byte])
x0    y0
x1    y1
:     :
lms1 = 0.10
rms1 = 0.74
lms2 = 0.75
rms2 = 0.96
bms  = 0.11
offsetylabel = -2.0
sizex = 7.5
sizey = 5
normalize = 4e-6

set tics font "Consolas,18"
set xlabel font "Consolas,18"
set ylabel font "Consolas,18"

set terminal pdf enhanced color size sizex in, sizey in
set output "scatter_bar.pdf"

binwidth=0.25*0.5
bin(x,width)=width*floor(x/width)+width/2.0
set table "histogram.txt"
plot "data.dat" u (bin(($2/normalize),binwidth)):(1.0) smooth freq with boxes
unset table

set ytics binwidth*4
set format y "%.1f"

set multiplot

set lmargin screen lms1
set rmargin screen rms1
set bmargin screen bms

set xtics 0, 100, 600
set xlabel "{/Consolas:Italic h} []"
set ylabel "{/Consolas:Italic f} []" offset offsetylabel,0
set xrange[0:650]
set yrange[0:]
plot "data.dat" u ($1/normalize):($2/normalize) with points ti "" pt 1 ps 0.5 lc "blue"


set lmargin screen lms2
set rmargin screen rms2

set xrange[0:*]
set xtics 70
set format y ""
set ylabel ""
set xlabel "Count []"
set style fill solid border lc rgb "black"
plot "histogram.txt" u ($2*0.5):($1):($2*0.5):(binwidth*0.5) with boxxyerrorbars lw 0.5 lc rgb "light-blue" ti ""

unset multiplot

set output
set terminal wxt
gnuplotではユーザー定義の変数が使用できる.
そこで,はじめに変数を定義してしまう.
lms1 = 0.10
rms1 = 0.74
lms2 = 0.75
rms2 = 0.96
bms  = 0.11
offsetylabel = -2.0
sizex = 7.5
sizey = 5
normalize = 4e-6
set tics font "Consolas,18"
set xlabel font "Consolas,18"
set ylabel font "Consolas,18"
set terminal pdf enhanced color size sizex in, sizey in
まず,bin(x,width)という,ヒストグラム用の棒グラフの棒の中央値にデータを丸める関数を定義する.
それをsmooth frequencyオプションでプロットすると,データを積み上げていくことができる.
これを利用して,度数分布を作っていくわけである.
なお,set tableとは,データを可視化するのではなく,表形式でファイルへ書き出す出力オプションである.
ここでhistogram.txtという度数分布表を出力した.
binwidth=0.25*0.5
bin(x,width)=width*floor(x/width)+width/2.0
set table "histogram.txt"
plot "data.dat" u (bin(($2/normalize),binwidth)):(1.0) smooth freq with boxes
unset table
複数のグラフを一枚にまとめる方法として,set multiplotとset multiplot layoutの2種類あるが,後者は自動配置なため,細かな設定ができない.
そこでここでは前者を用いて,マージンを細く設定することによって,複数のグラフを統合した.
set multiplot
unset multiplot
で,multiplot環境をセット.
set lmargin screen lms1
set rmargin screen rms1
set bmargin screen bms

set xtics 0, 100, 600
set xlabel "{/Consolas:Italic h} []"
set ylabel "{/Consolas:Italic f} []" offset offsetylabel,0
set xrange[0:650]
set yrange[0:]
plot "data.dat" u ($1/normalize):($2/normalize) with points ti "" pt 1 ps 0.5 lc "blue"
set lmargin screen lms2
set rmargin screen rms2

set xrange[0:*]
set xtics 70
set format y ""
set ylabel ""
set xlabel "Count []"
set style fill solid border lc rgb "black"
plot "histogram.txt" u ($2*0.5):($1):($2*0.5):(binwidth*0.5) with boxxyerrorbars lw 0.5 lc rgb "light-blue" ti ""
で,それぞれのグラフサイズを設定した後,プロットしている.
gnuplotには横向き棒グラフが実装されていない.
そこでここではwith boxxyerrorbarsによってボックスを描画することによって棒グラフを仮想的に実現した.
以下で($2*0.5)などとしているのは,棒グラフとなるボックスの中心座標を求めるためである.
set style fill solid border lc rgb "black"
plot "histogram.txt" u ($2*0.5):($1):($2*0.5):(binwidth*0.5) with boxxyerrorbars lw 0.5 lc rgb "light-blue" ti ""
set xlabel "{/Consolas:Italic h} []"
set ylabel "{/Consolas:Italic f} []" offset offsetylabel,0
set ylabel "{/Consolas:Italic f} []" offset offsetylabel,0
名前
Email (※公開されることはありません)
コメント