gnuplotのコマンドセットの備忘録 その2.
今回は流体力学などで用いる流れの可視化をしてみる.
Microsoft Windows 10 Home (64bit)
Gnuplot Version 5.2 patchlevel 0
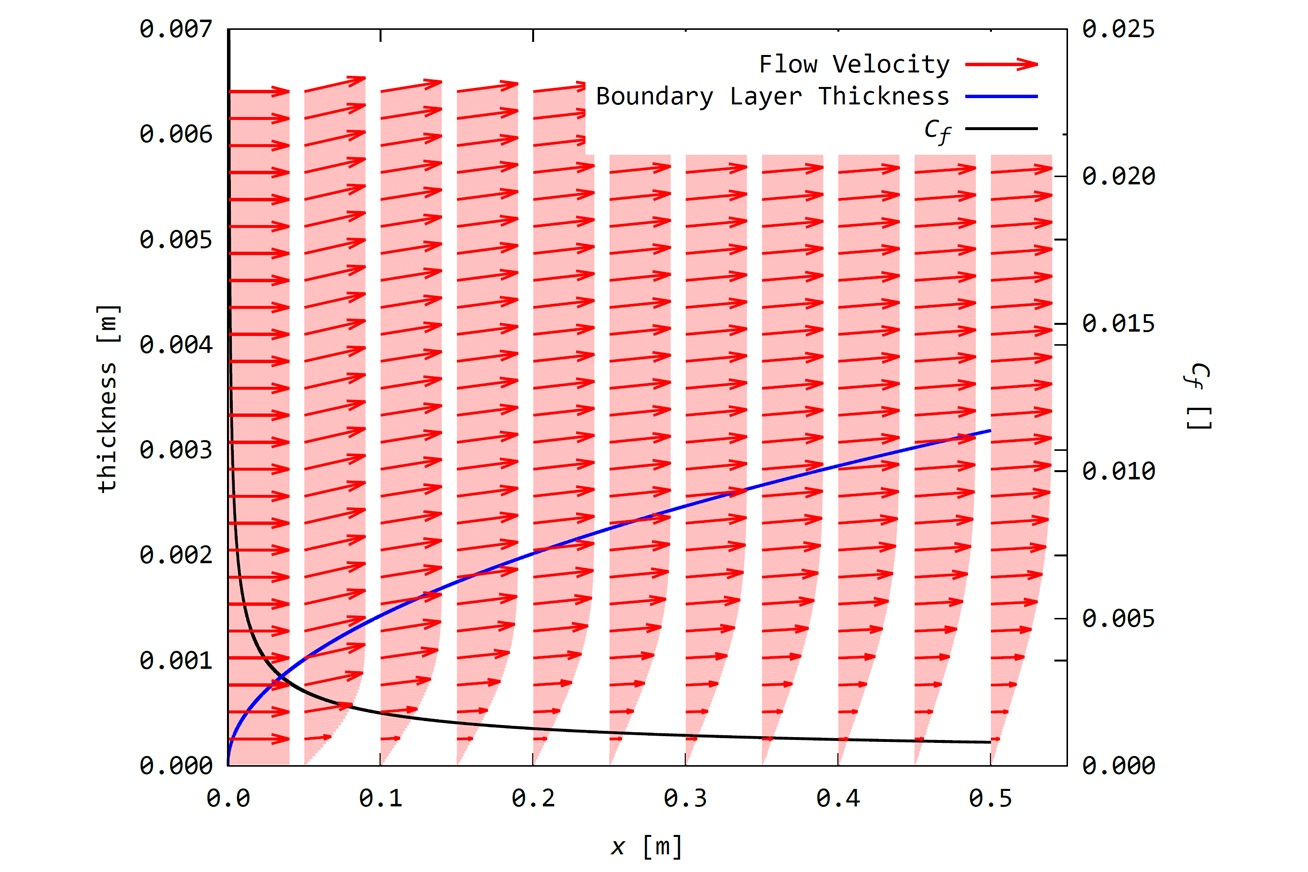
塗りつぶしを多数の矢先のないベクトルで表現し,間引いたベクトルデータで流線を表現する.
間引いたデータセットを別途用意したが,every コマンドを用いればその必要はなかったかもしれない.
▶ データファイル (FlowVectorAll.dat [85,698 byte])
x0    y0    δx0   δy0
x1    y1    δx1   δy1
:     :      :     :
▶ データファイル (FlowVector.dat [8,676 byte])
x00   y00   δx00  δy00
x01   y01   δx01  δy01
 :     :     :     :
x0N   y0N   δx0N  δy0N


x10   y10   δx10  δy10
x11   y11   δx11  δy11
 :     :     :     :
▶ データファイル (Bt.dat [993,878 byte])
▶ データファイル (Cf.dat [1,006,316 byte])
x0   y0
x1   y1
:     :
set y2tics
plot "FlowVectorAll.dat" u 1:2:($3*0.002):($4*0.002)  w vector empty nohead  lc rgb "pink" lw 2 ti ""
replot "Cf.dat"          u 1:2 w l lc rgb "black" lw 2 ti "{/Consolas:Italic C}_{/Consolas:Italic f}" axes x1y2
replot "Bt.dat"          u 1:2 w l lc rgb "blue"  lw 2 ti "Boundary Layer Thickness"
replot "FlowVector.dat"  u 1:2:($3*0.002):($4*0.002)  w vector lw 2 lc rgb "red" ti "Flow Velocity"

set key opaque box linewidth 15 linecolor rgb "white" height 0.2 width 0

set key invert
set xlabel  "{/Consolas:Italic x} [m]"
set ylabel  "thickness [m]"
set y2label "{/Consolas:Italic C}_{/Consolas:Italic f} []" rotate by -90
set xrange [0:0.55]
set yrange [0:0.007]
set y2range[0:0.025]
set format x  "%.1f"
set format y  "%.3f"
set format y2 "%.3f"
replot

set tics    font "Consolas,12"
set key     font "Consolas,12"
set title   font "Consolas,12"
set xlabel  font "Consolas,12"
set ylabel  font "Consolas,12"
set zlabel  font "Consolas,12"
set y2label font "Consolas,12"
set cblabel font "Consolas,12"

set terminal pdf enhanced color size 6.0in, 4.5in
set output "graph.pdf"
replot
set output
set terminal wxt
set y2tics
replot "Cf.dat" u 1:2 w l lc rgb "black" lw 2 ti "{/Consolas:Italic C}_{/Consolas:Italic f}" axes x1y2
set y2label "{/Consolas:Italic C}_{/Consolas:Italic f} []" rotate by -90
plot "FlowVectorAll.dat" u 1:2:($3*0.002):($4*0.002) w vector empty nohead lc rgb "pink" lw 2 ti ""
plot "FlowVectorAll.dat" u 1:2:($3*0.002):($4*0.002) w vector empty nohead lc rgb "pink" lw 2 ti ""
replot "FlowVector.dat" u 1:2:($3*0.002):($4*0.002) w vector lw 2 lc rgb "red" ti "Flow Velocity"
replot "Cf.dat"          u 1:2 w l lc rgb "black" lw 2 ti "{/Consolas:Italic C}_{/Consolas:Italic f}" axes x1y2
replot "Bt.dat"          u 1:2 w l lc rgb "blue"  lw 2 ti "Boundary Layer Thickness"
gnuplotでは,後から書いたグラフが上層へくるので,表面に出したいものを後でプロットする.
凡例の順番をきにするために,ここでは凡例の順番を入れ替えた.
plot "FlowVectorAll.dat" u 1:2:($3*0.002):($4*0.002) w vector empty nohead lc rgb "pink" lw 2 ti ""
replot "Cf.dat" u 1:2 w l lc rgb "black" lw 2 ti "{/Consolas:Italic C}_{/Consolas:Italic f}" axes x1y2
replot "Bt.dat" u 1:2 w l lc rgb "blue" lw 2 ti "Boundary Layer Thickness"
replot "FlowVector.dat" u 1:2:($3*0.002):($4*0.002) w vector lw 2 lc rgb "red" ti "Flow Velocity"
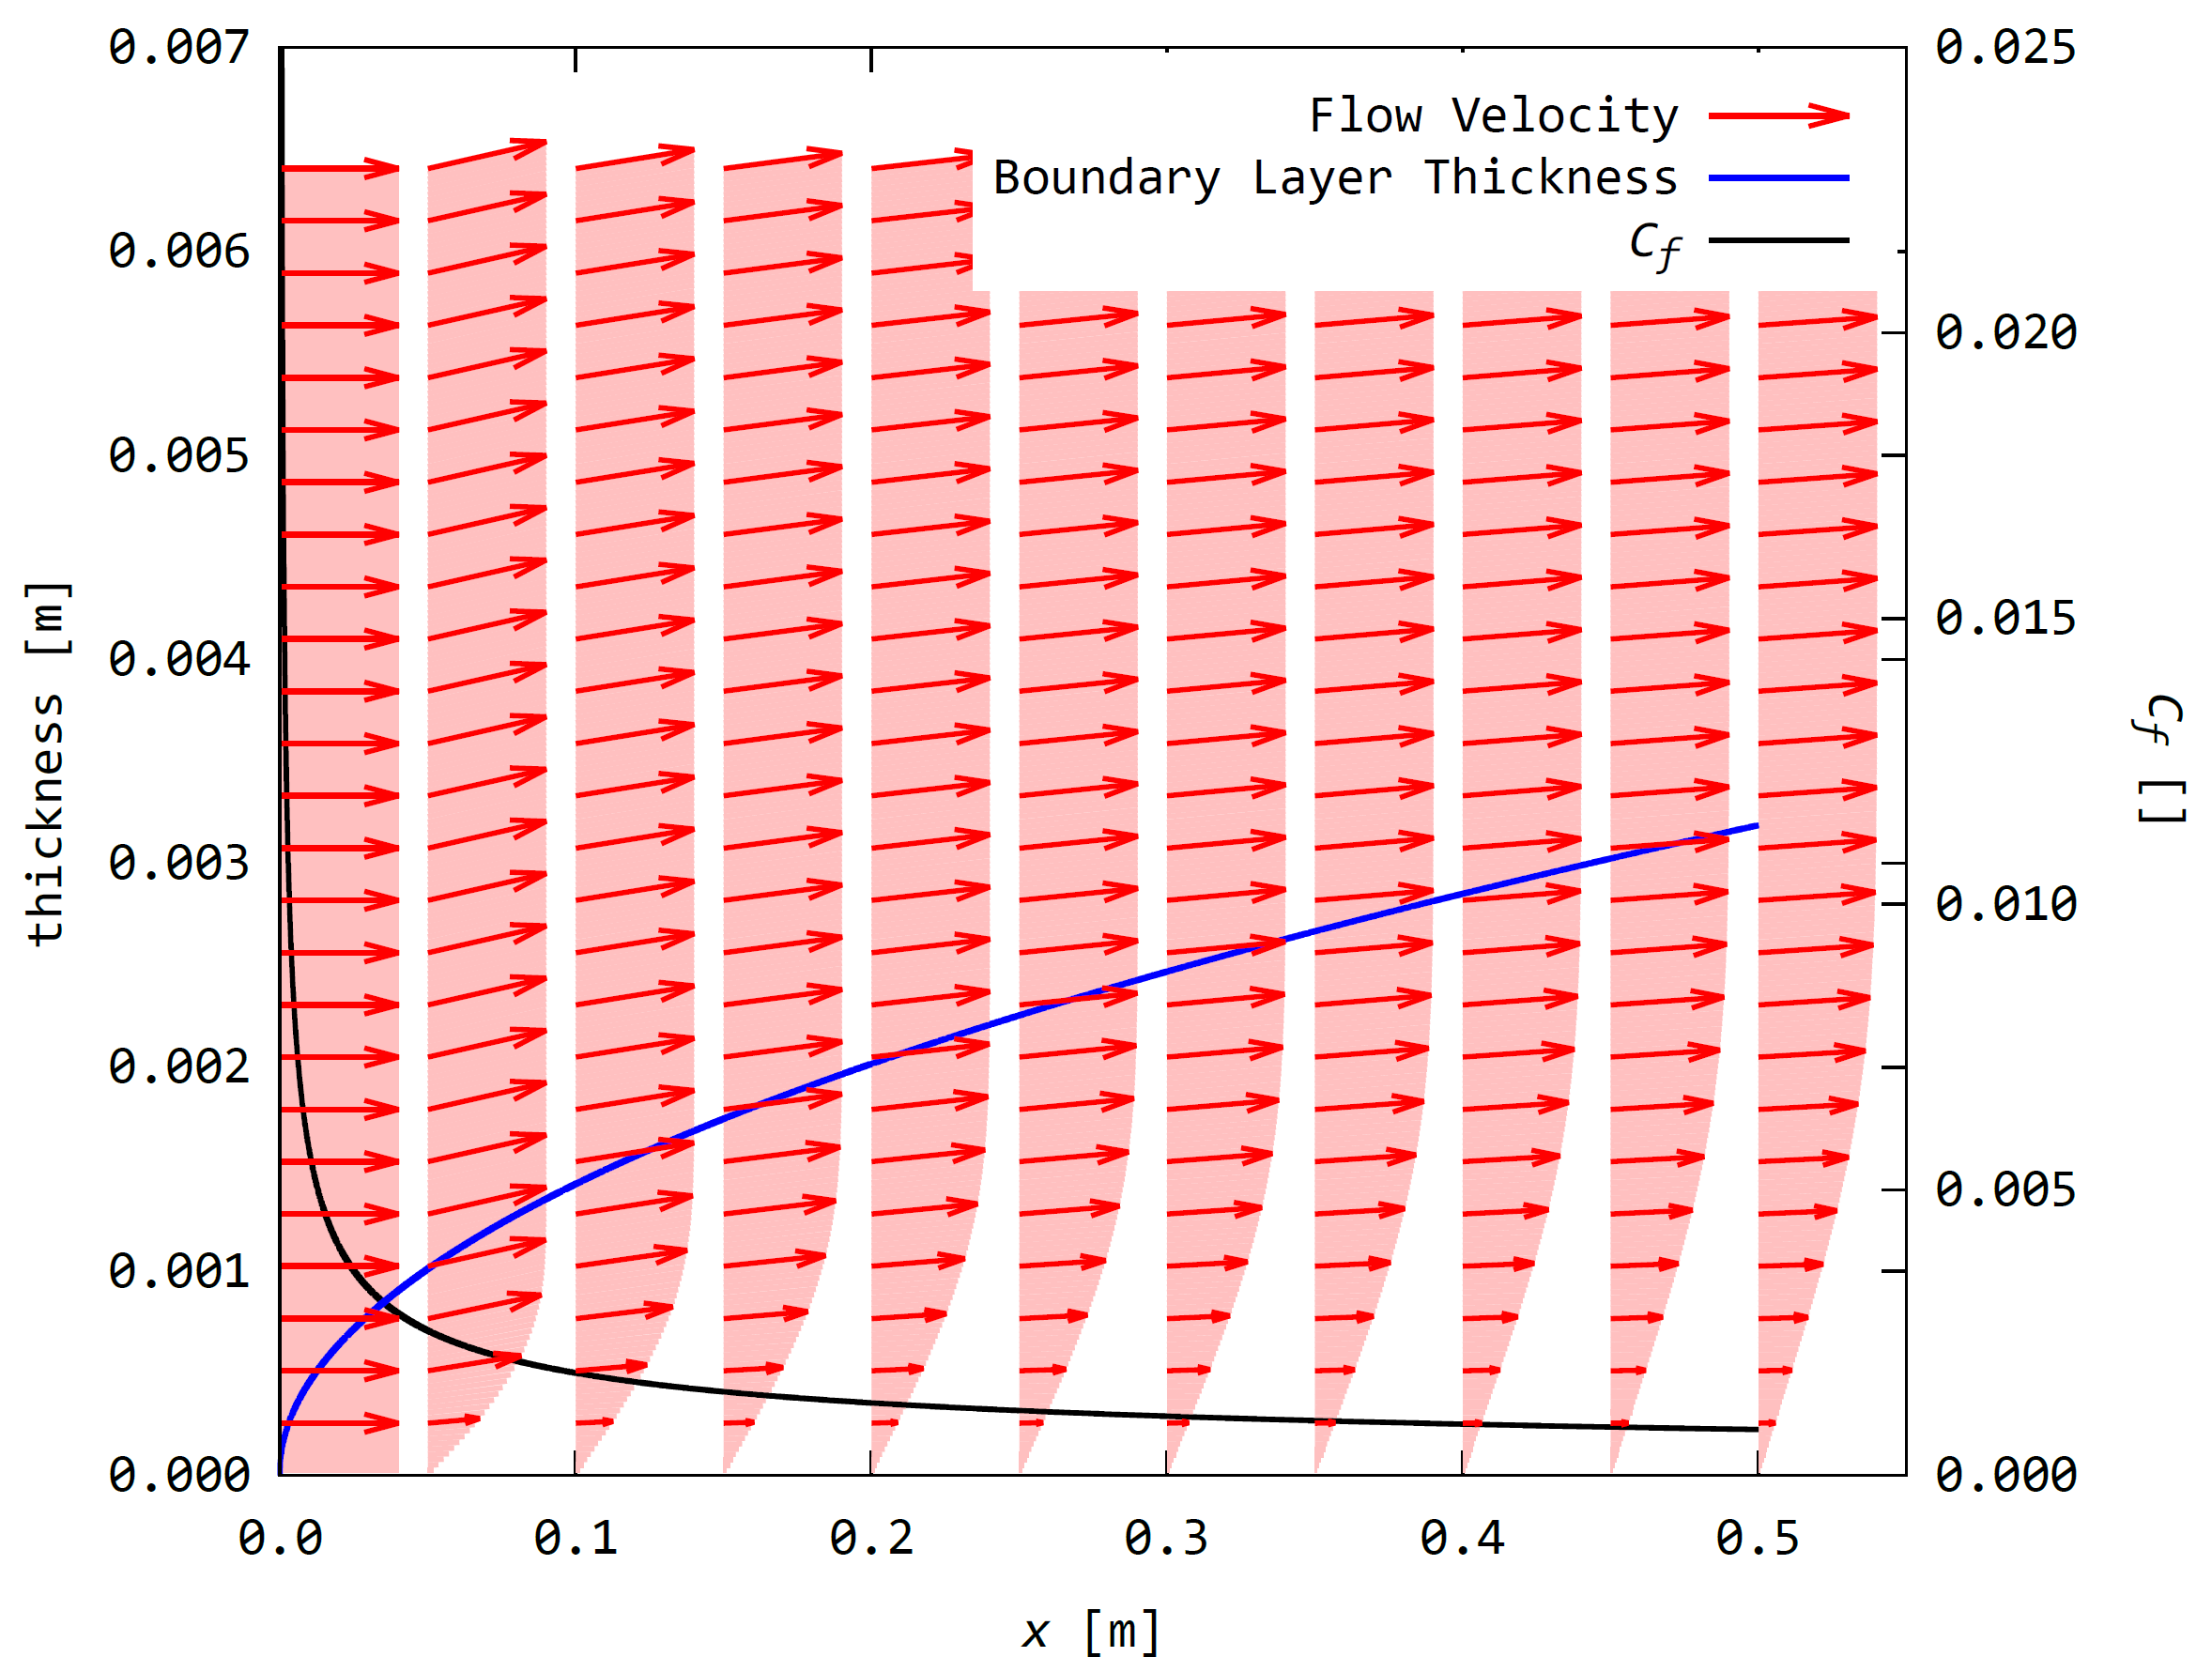
set key opaque box linewidth 15 linecolor rgb "white" height 0.2 width 0
set key invert
凡例背景をを白にした.
linewidth で枠の太さを,width, heightで上左のマージンを調整することによって,凡例Boxの余白を微調整した.
set key opaque box linewidth 15 linecolor rgb "white" height 0.2 width 0
set y2label "{/Consolas:Italic C}_{/Consolas:Italic f} []" rotate by -90
set y2label "{/Consolas:Italic C}_{/Consolas:Italic f} []" rotate by -90
set tics    font "Consolas,12"
set key     font "Consolas,12"
set title   font "Consolas,12"
set xlabel  font "Consolas,12"
set ylabel  font "Consolas,12"
set zlabel  font "Consolas,12"
set y2label font "Consolas,12"
set cblabel font "Consolas,12"
set terminal pdf enhanced color size 6.0in, 4.5in
名前
Email (※公開されることはありません)
コメント